PetroAlign

Well log correlation · Petrophysics

Correlate wells and evaluate pay in one tool

PetroAlign loads your LAS files, lets you pick and flatten formation tops across wells, runs a quick-look petrophysical interpretation and exports true-scale correlation panels. It runs in your web browser, with nothing to install and no sign-in.

Version 1.6 · Chrome, Edge, Firefox and Safari · LAS 1.2, 2.0 and 3.0

PetroAlign · three wells flattened on Top Sand A
PetroAlign showing three wells side by side with gamma ray, resistivity, density–neutron, porosity, saturation, permeability, facies and ELAN volume tracks, correlated on formation tops.

A demo project with generated wells, picks, a fault, lease blocks and a seismic time surface is included so you can try every feature straight away.

What it does

From LAS files to a finished correlation

Correlation

Pick, flatten and compare

Place formation tops by clicking on a well, drag them to adjust, and see the correlation lines and zones update across every well at once.

  • Flatten on any top, or view all wells in TVD or structural TVDSS
  • TVD from deviation surveys by minimum curvature, with KB and GL elevations
  • Import well heads and deviation surveys for many wells at once from ASCII, CSV, Excel or Petrel .dev files
  • Interwell distance from X/Y or latitude/longitude, with proportional spacing
  • Proposed wells with planned trajectories and target depths
  • Zoom the whole panel out, or fit every well on screen at once
  • Import and export tops as CSV, Excel or Petrel well-tops files
  • Synthetic seismogram from sonic and density, tied to your TWT picks by bulk shift or stretch
  • Undo and redo every edit with Ctrl+Z and Ctrl+Y
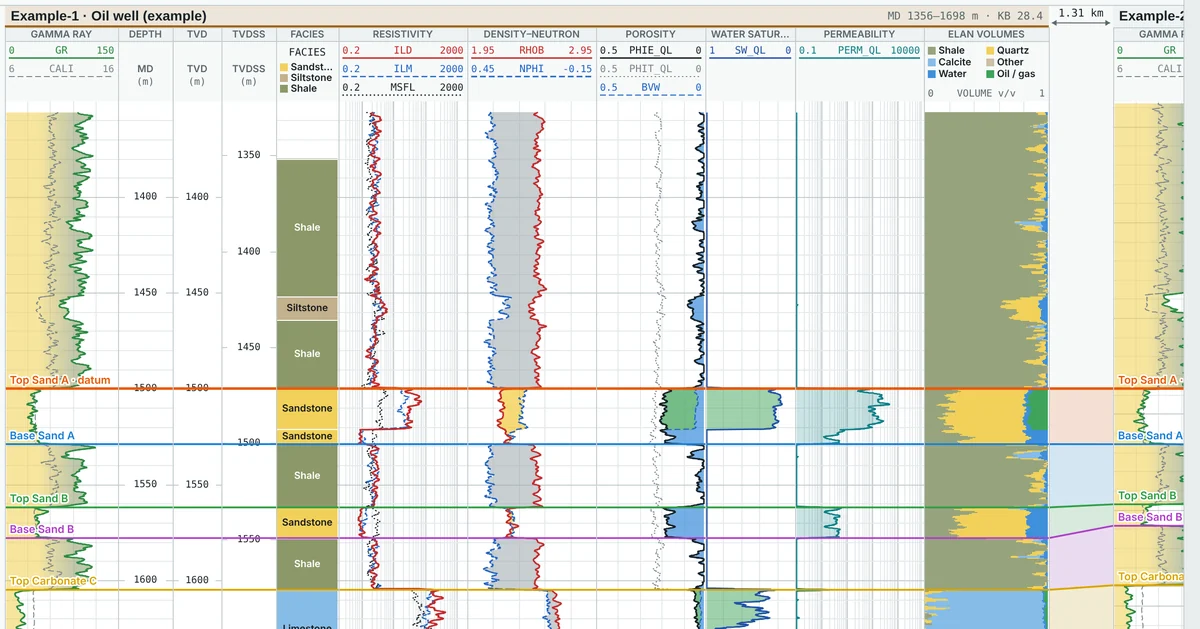
Close view of a correlation panel with tops joined between wells and the distance between wells shown above.
Petrophysics

Quick-look interpretation

Run a transparent, parameter-driven evaluation on one well or all wells, or load results from your interpretation software.

  • Vsh: linear, Larionov or Clavier
  • Density–neutron porosity and Archie, Simandoux or Indonesia water saturation
  • Permeability by Timur, Coates or a core-based porosity transform
  • Core data shown on the log tracks, with a depth shift and a permeability transform fitted to core
  • Log curves from ASCII, CSV or Excel columns as well as LAS
  • ELAN-style volumes and a net pay summary by zone: N/G, Φe, Sw, k·h
  • Crossplots and histograms of any curves, filtered by well, zone and depth
  • Maps over a shapefile base map: depth and time structure, depth conversion, isochore, isopach, velocity, net pay, porosity, saturation and k·h
  • Volumetrics above a fluid contact: GRV, HCPV and STOIIP or GIIP
  • Faults you draw on the map, honoured by gridding, with a map title and legend
  • Project coordinate reference system from 6,500 EPSG systems, or one you define
  • Base maps from shapefile, KML/KMZ, GeoJSON, DXF, CSV/Excel and GeoTIFF or JPG/PNG images; grids from ZMap+, Surfer, CPS-3, IRAP, EarthVision, Esri ASCII and XYZ
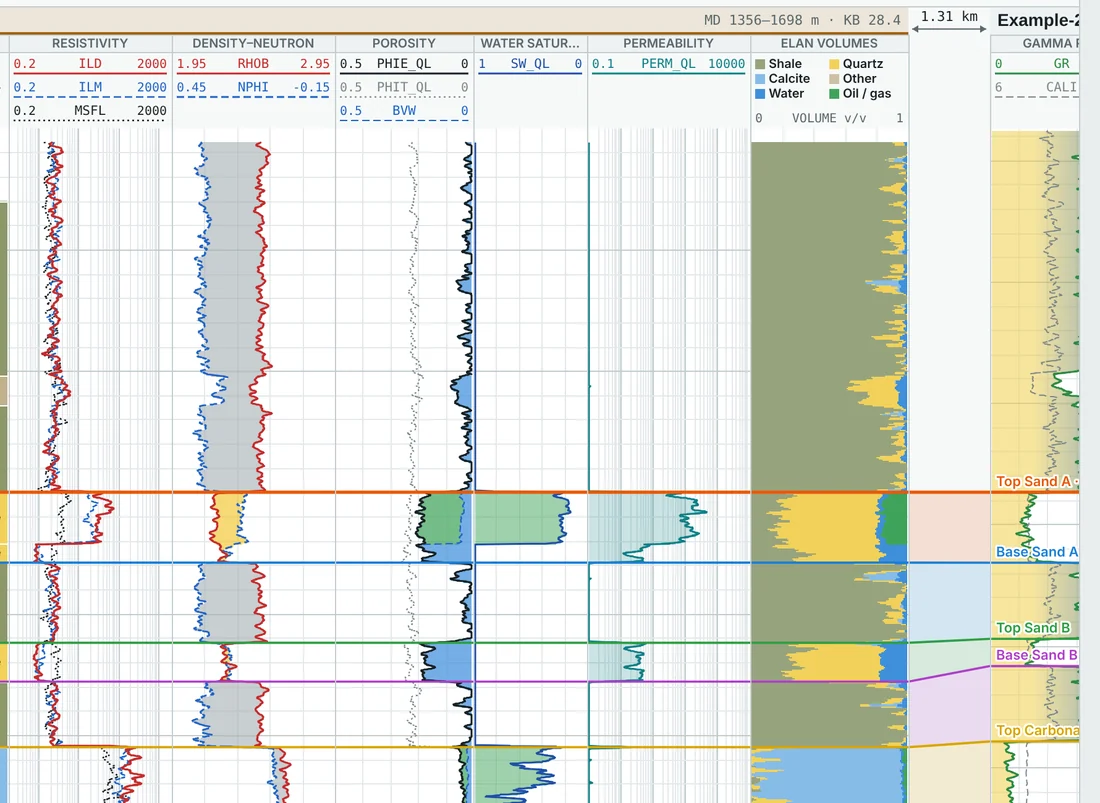
Resistivity, density–neutron, porosity, water saturation, permeability and ELAN volume tracks over a hydrocarbon-bearing sand.
Tracks and curves

Your layout, your curves

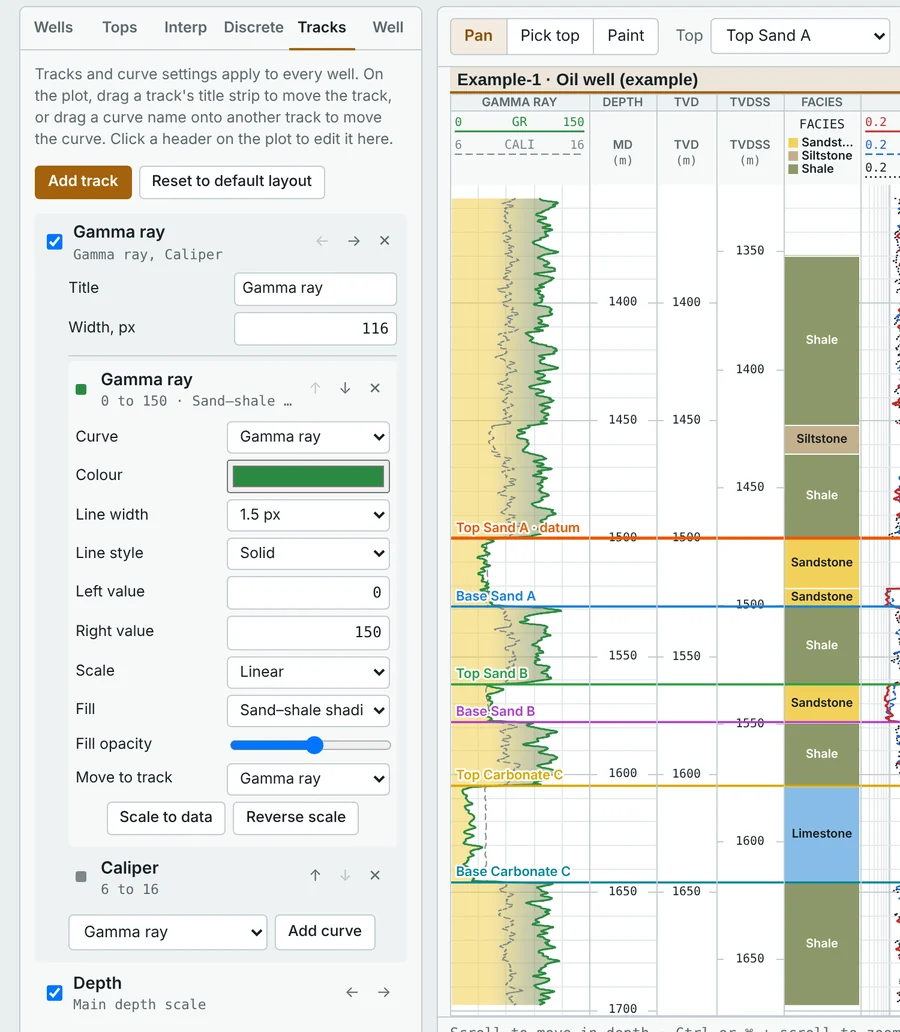
Build the display you are used to. Every track and curve is configurable, and the layout applies to every well.

  • Drag tracks and curves anywhere on the plot
  • Colour, line style, linear or log scale and fills for each curve
  • Curve calculator for your own formulas, such as (GR-20)/(105-20)
  • Splice logs from different runs into one continuous curve
Track settings panel next to the log display, with curve colour, scale and fill options.
Discrete logs

Facies you can paint

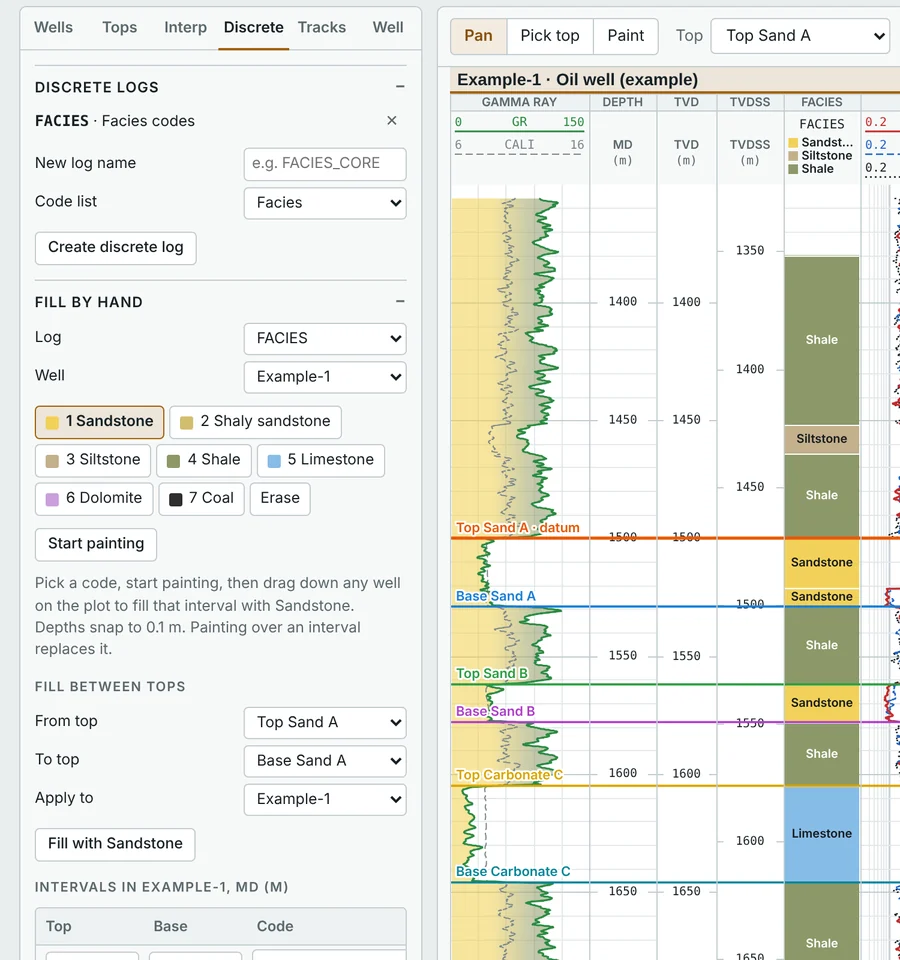
Create discrete logs such as facies or lithology and fill them by dragging down a well, between tops, or from a curve.

  • Your own code lists with names and colours
  • Interval table for exact depths
  • Use discrete logs in formulas and LAS exports
Discrete log panel with facies codes and a painted facies column beside the logs.
Output

Ready to present

PDFTrue vertical scale, split over pages, or fitted to A4 or A3
ImagesPNG, JPEG and WebP up to 288 dpi
LASWells with all original, calculated and interpreted curves
CSVTops in MD, TVD and TVDSS, and net pay by zone
ProjectsSave and reopen your complete work as one file

Your data

Your well data stays on your computer

  • Nothing is uploaded. LAS files, tops and interpretations are read and processed inside your browser and kept on your computer.
  • Nothing to install. No setup, no licence server and no sign-in. Open the page and start working.
  • Your files, your control. Save projects where you choose and share them only when you decide to.

Get started

Open PetroAlign in your browser

Open PetroAlign
Version
1.7
Browsers
Chrome, Edge, Firefox and Safari on a laptop or desktop
Formats
LAS 1.2, 2.0 and 3.0, plus ASCII, CSV and Excel
Cost
Free to use
  1. Open the app

    Example wells load straight away so you can explore every tool first.

  2. Load your LAS files

    Drag them onto the page, or use Load LAS files. They are read in your browser and never uploaded.

  3. Save your project

    Your work is kept in this browser between visits. Use Save project to keep a copy as a file or move it to another computer.

Clearing your browser's site data also clears work kept in the browser, so save a project file for anything important.

Feedback

Tell me what to improve

Found a bug, a LAS file that will not load, or a feature you need for your work? Send a note and it comes straight to me.

Only what you type here is sent. Your well data is never attached. If something will not load, describe it, or share a sample only if you are allowed to.